MetaTrader 5
 MetaTrader 4
 Alpaca
 Interactive Brokers
 cTrader
 TradeStation
Live Chart · MT5 & MT4
The ticket lives on the chart.
Your MetaTrader terminal feeds the chart. You draw the trade where you see it — drag the entry, the stop and the target on the price axis — and the ticket beside it recalculates as you move them. The order that gets placed is the one on the screen.
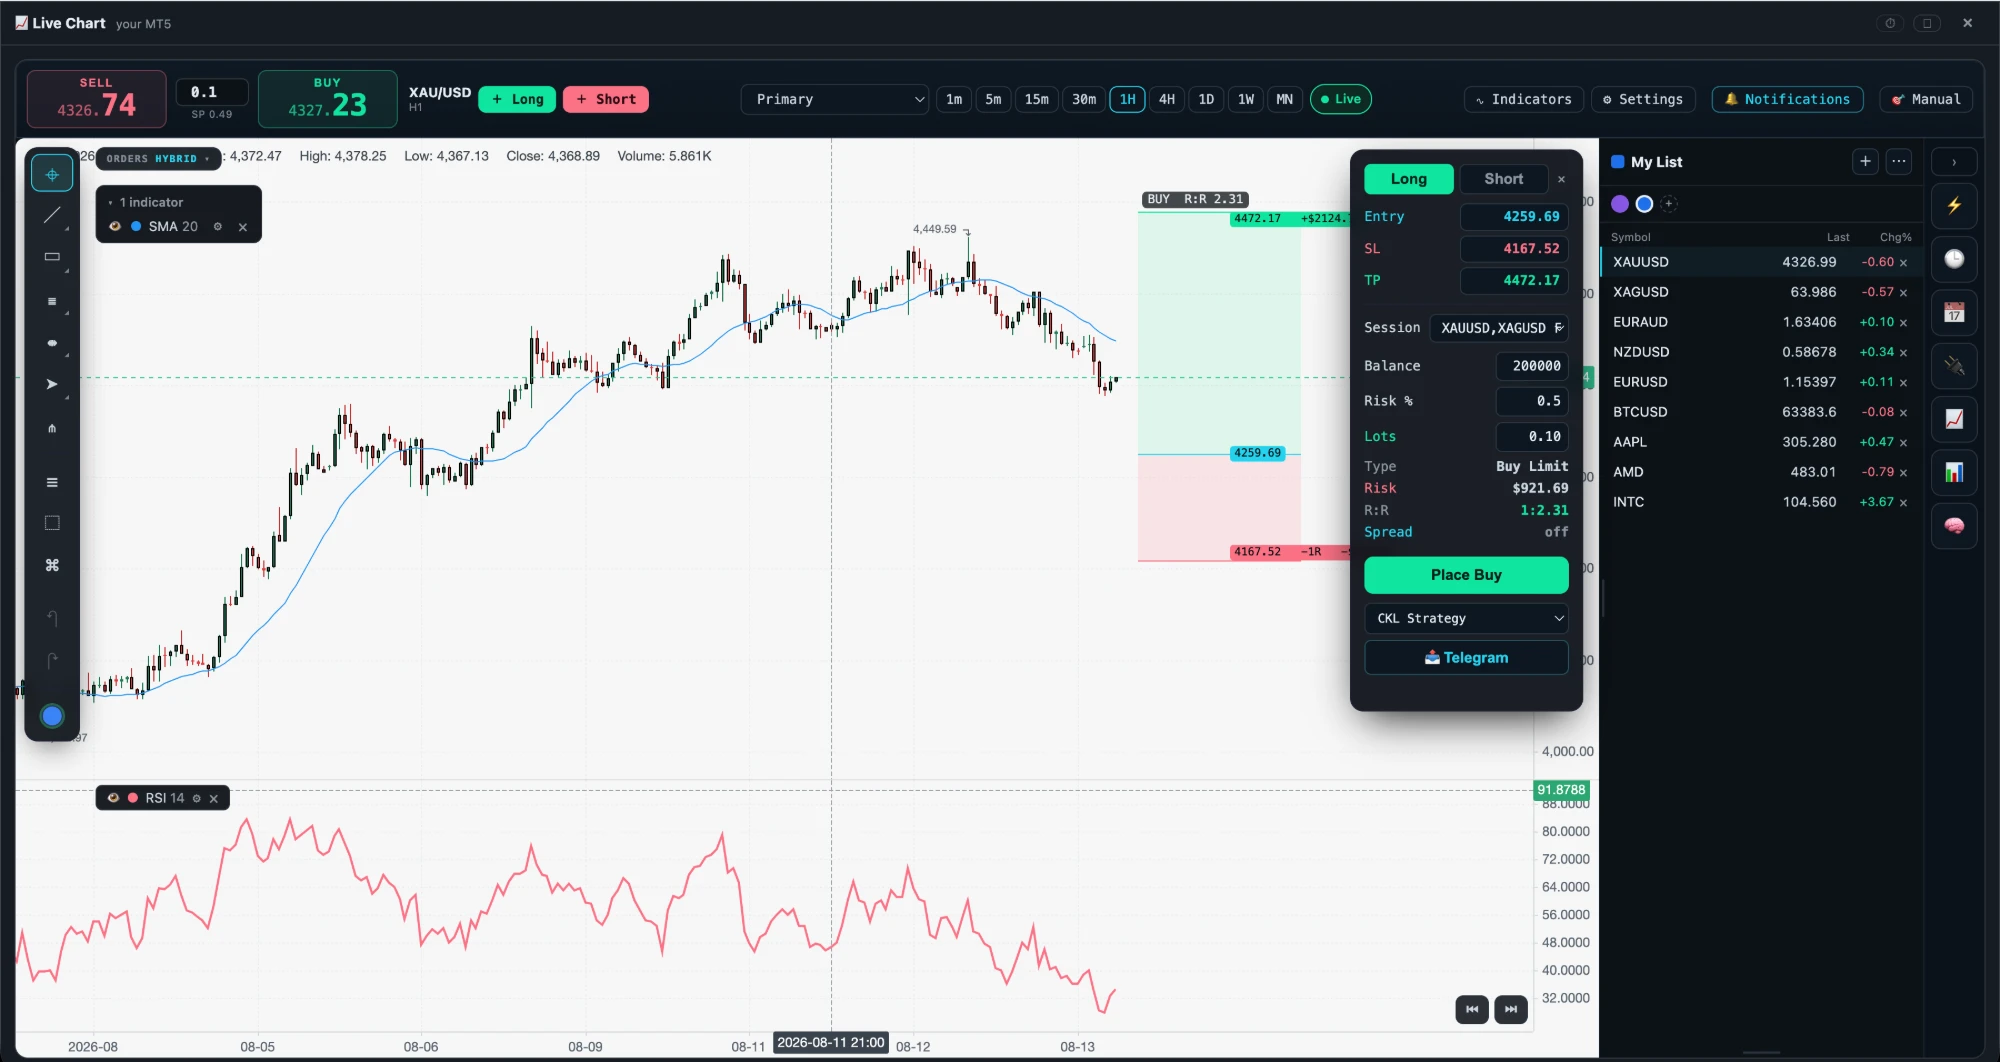
Trade from the chartLong or short, with the entry, stop and target as draggable levels rather than typed numbers.
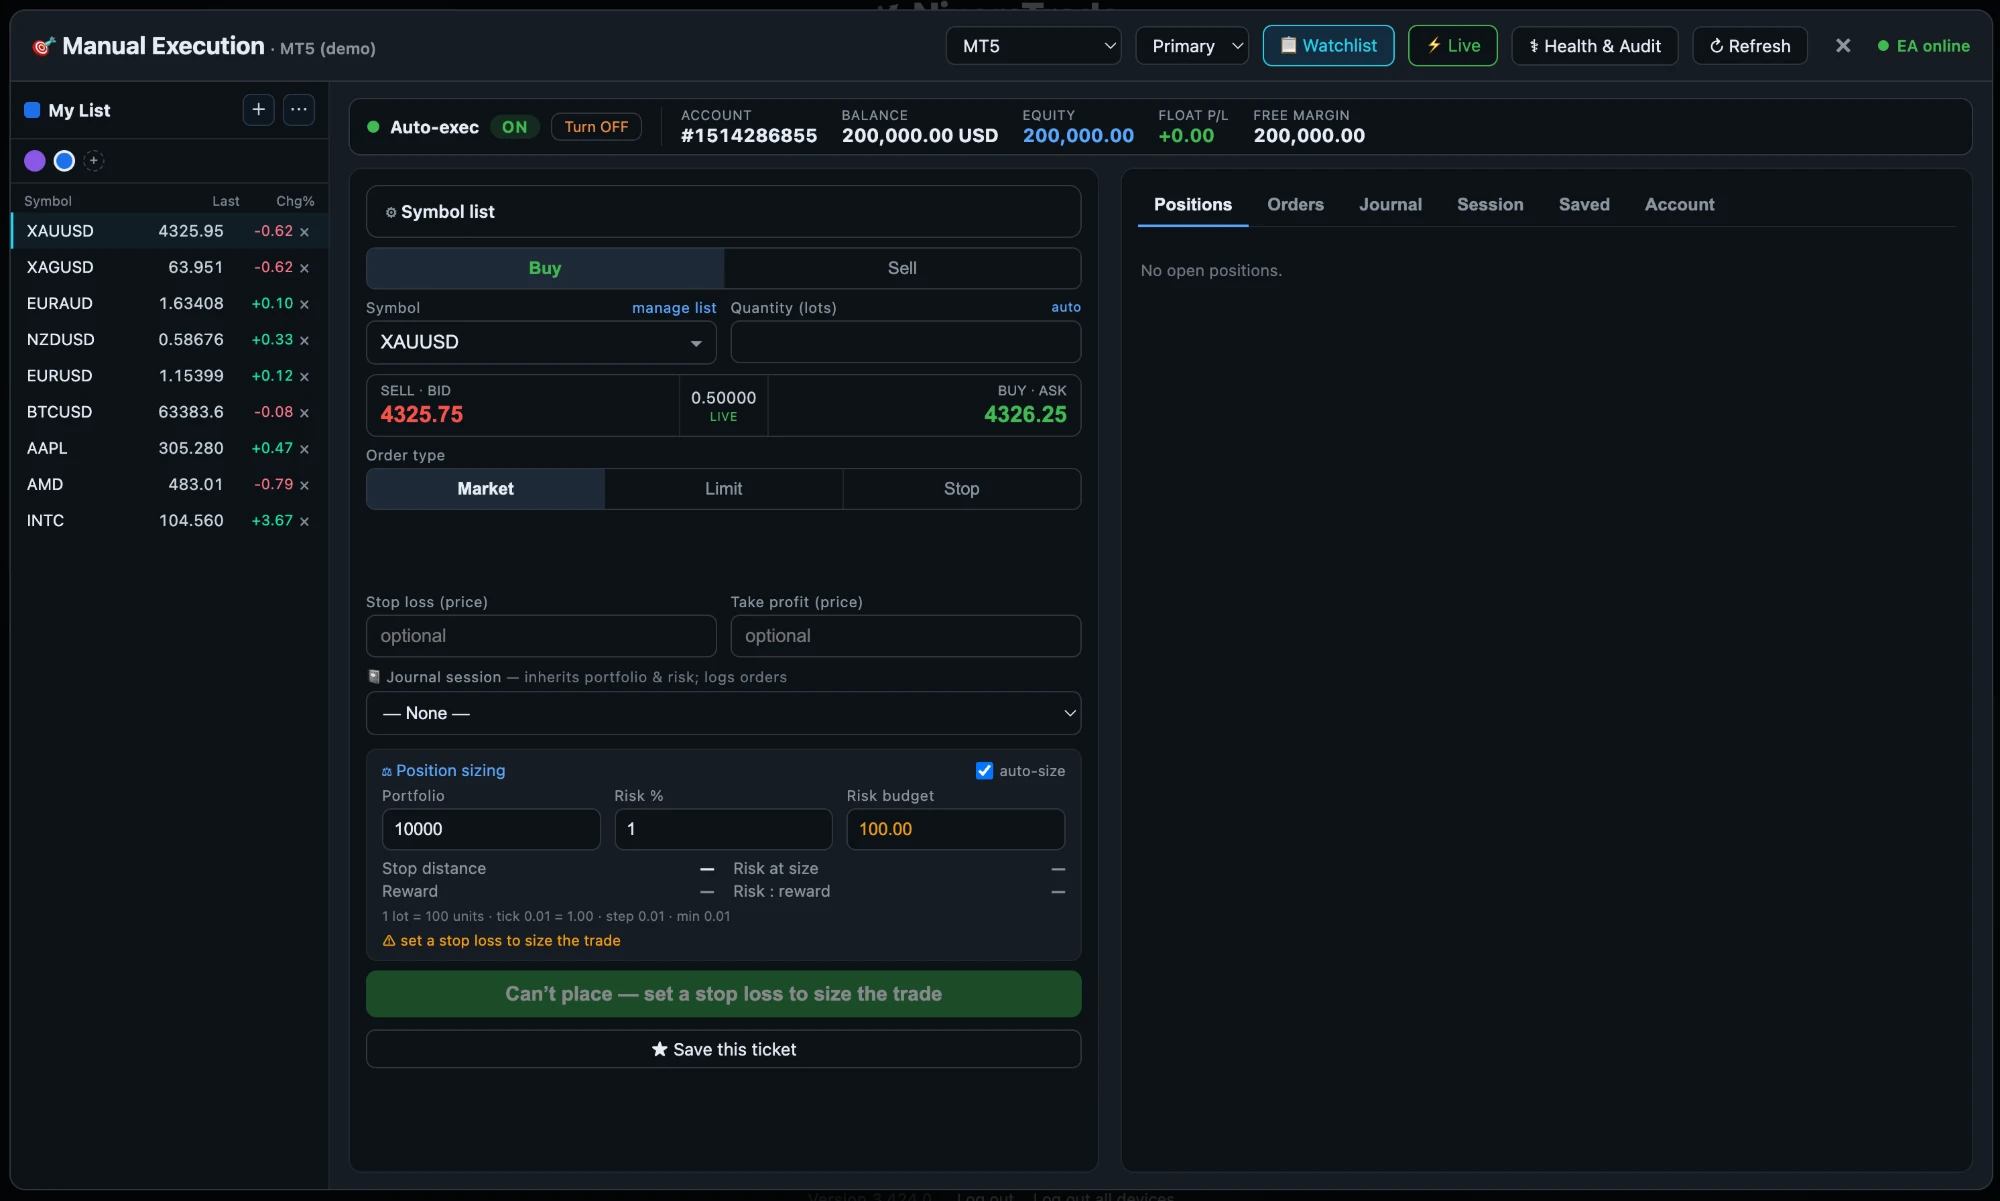
Risk on the paneBalance, risk %, lots, money at risk and R:R are all shown before you commit — this one reads 1:2.31 and $921.69.
Reward and risk shadedThe green block is what the target is worth, the red block is what the stop costs.
Indicators and drawings73 indicators. Here SMA 20 on price and RSI 14 in its own pane.
Watchlist alongsideLive last price and change on every symbol you follow, colour-tagged and synced to your account.
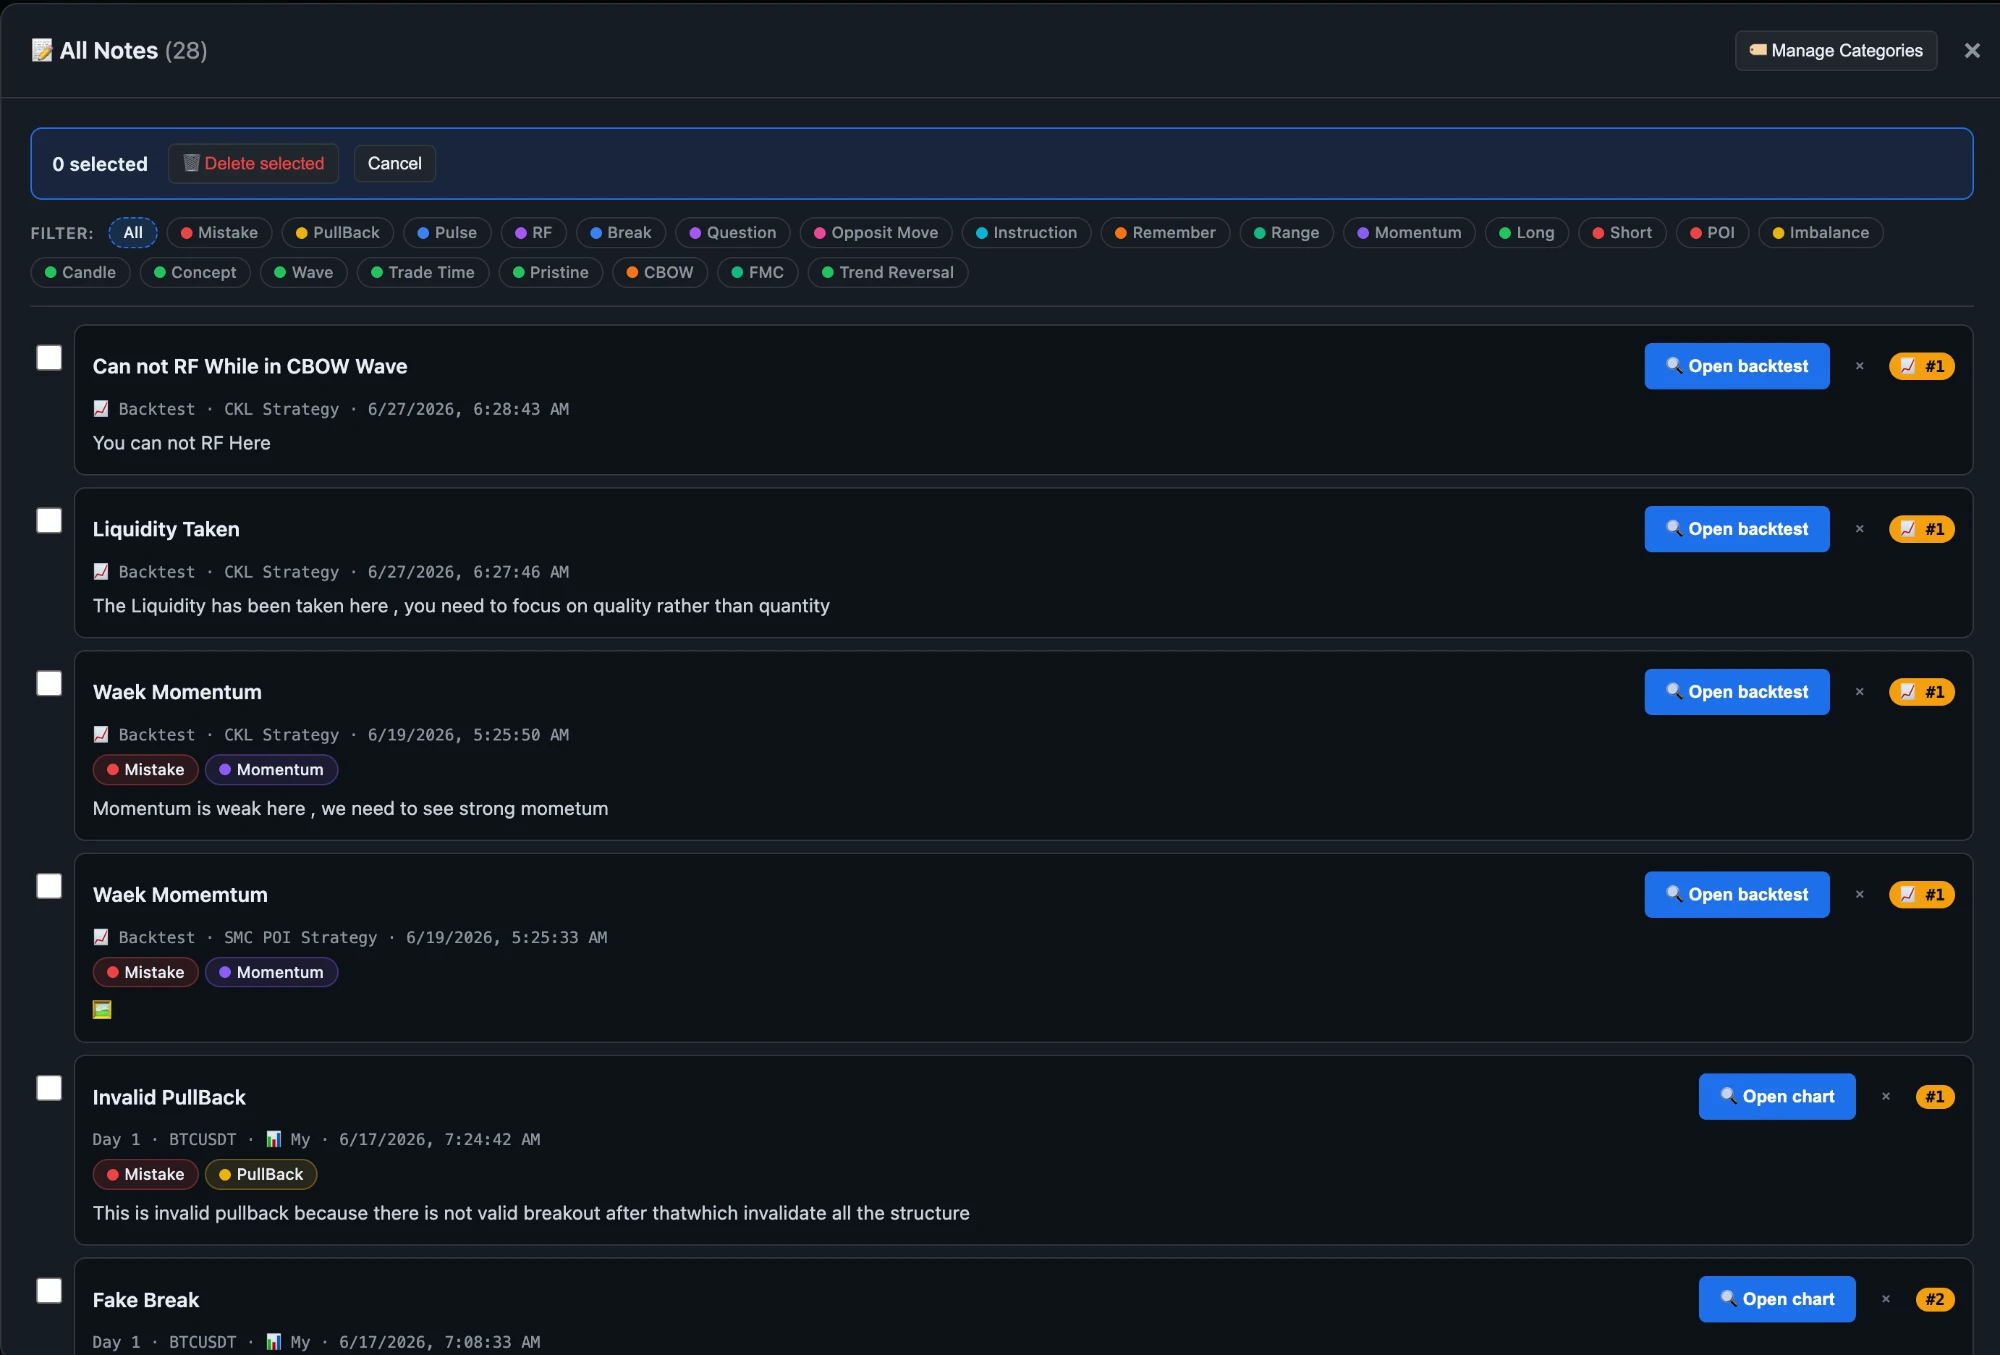
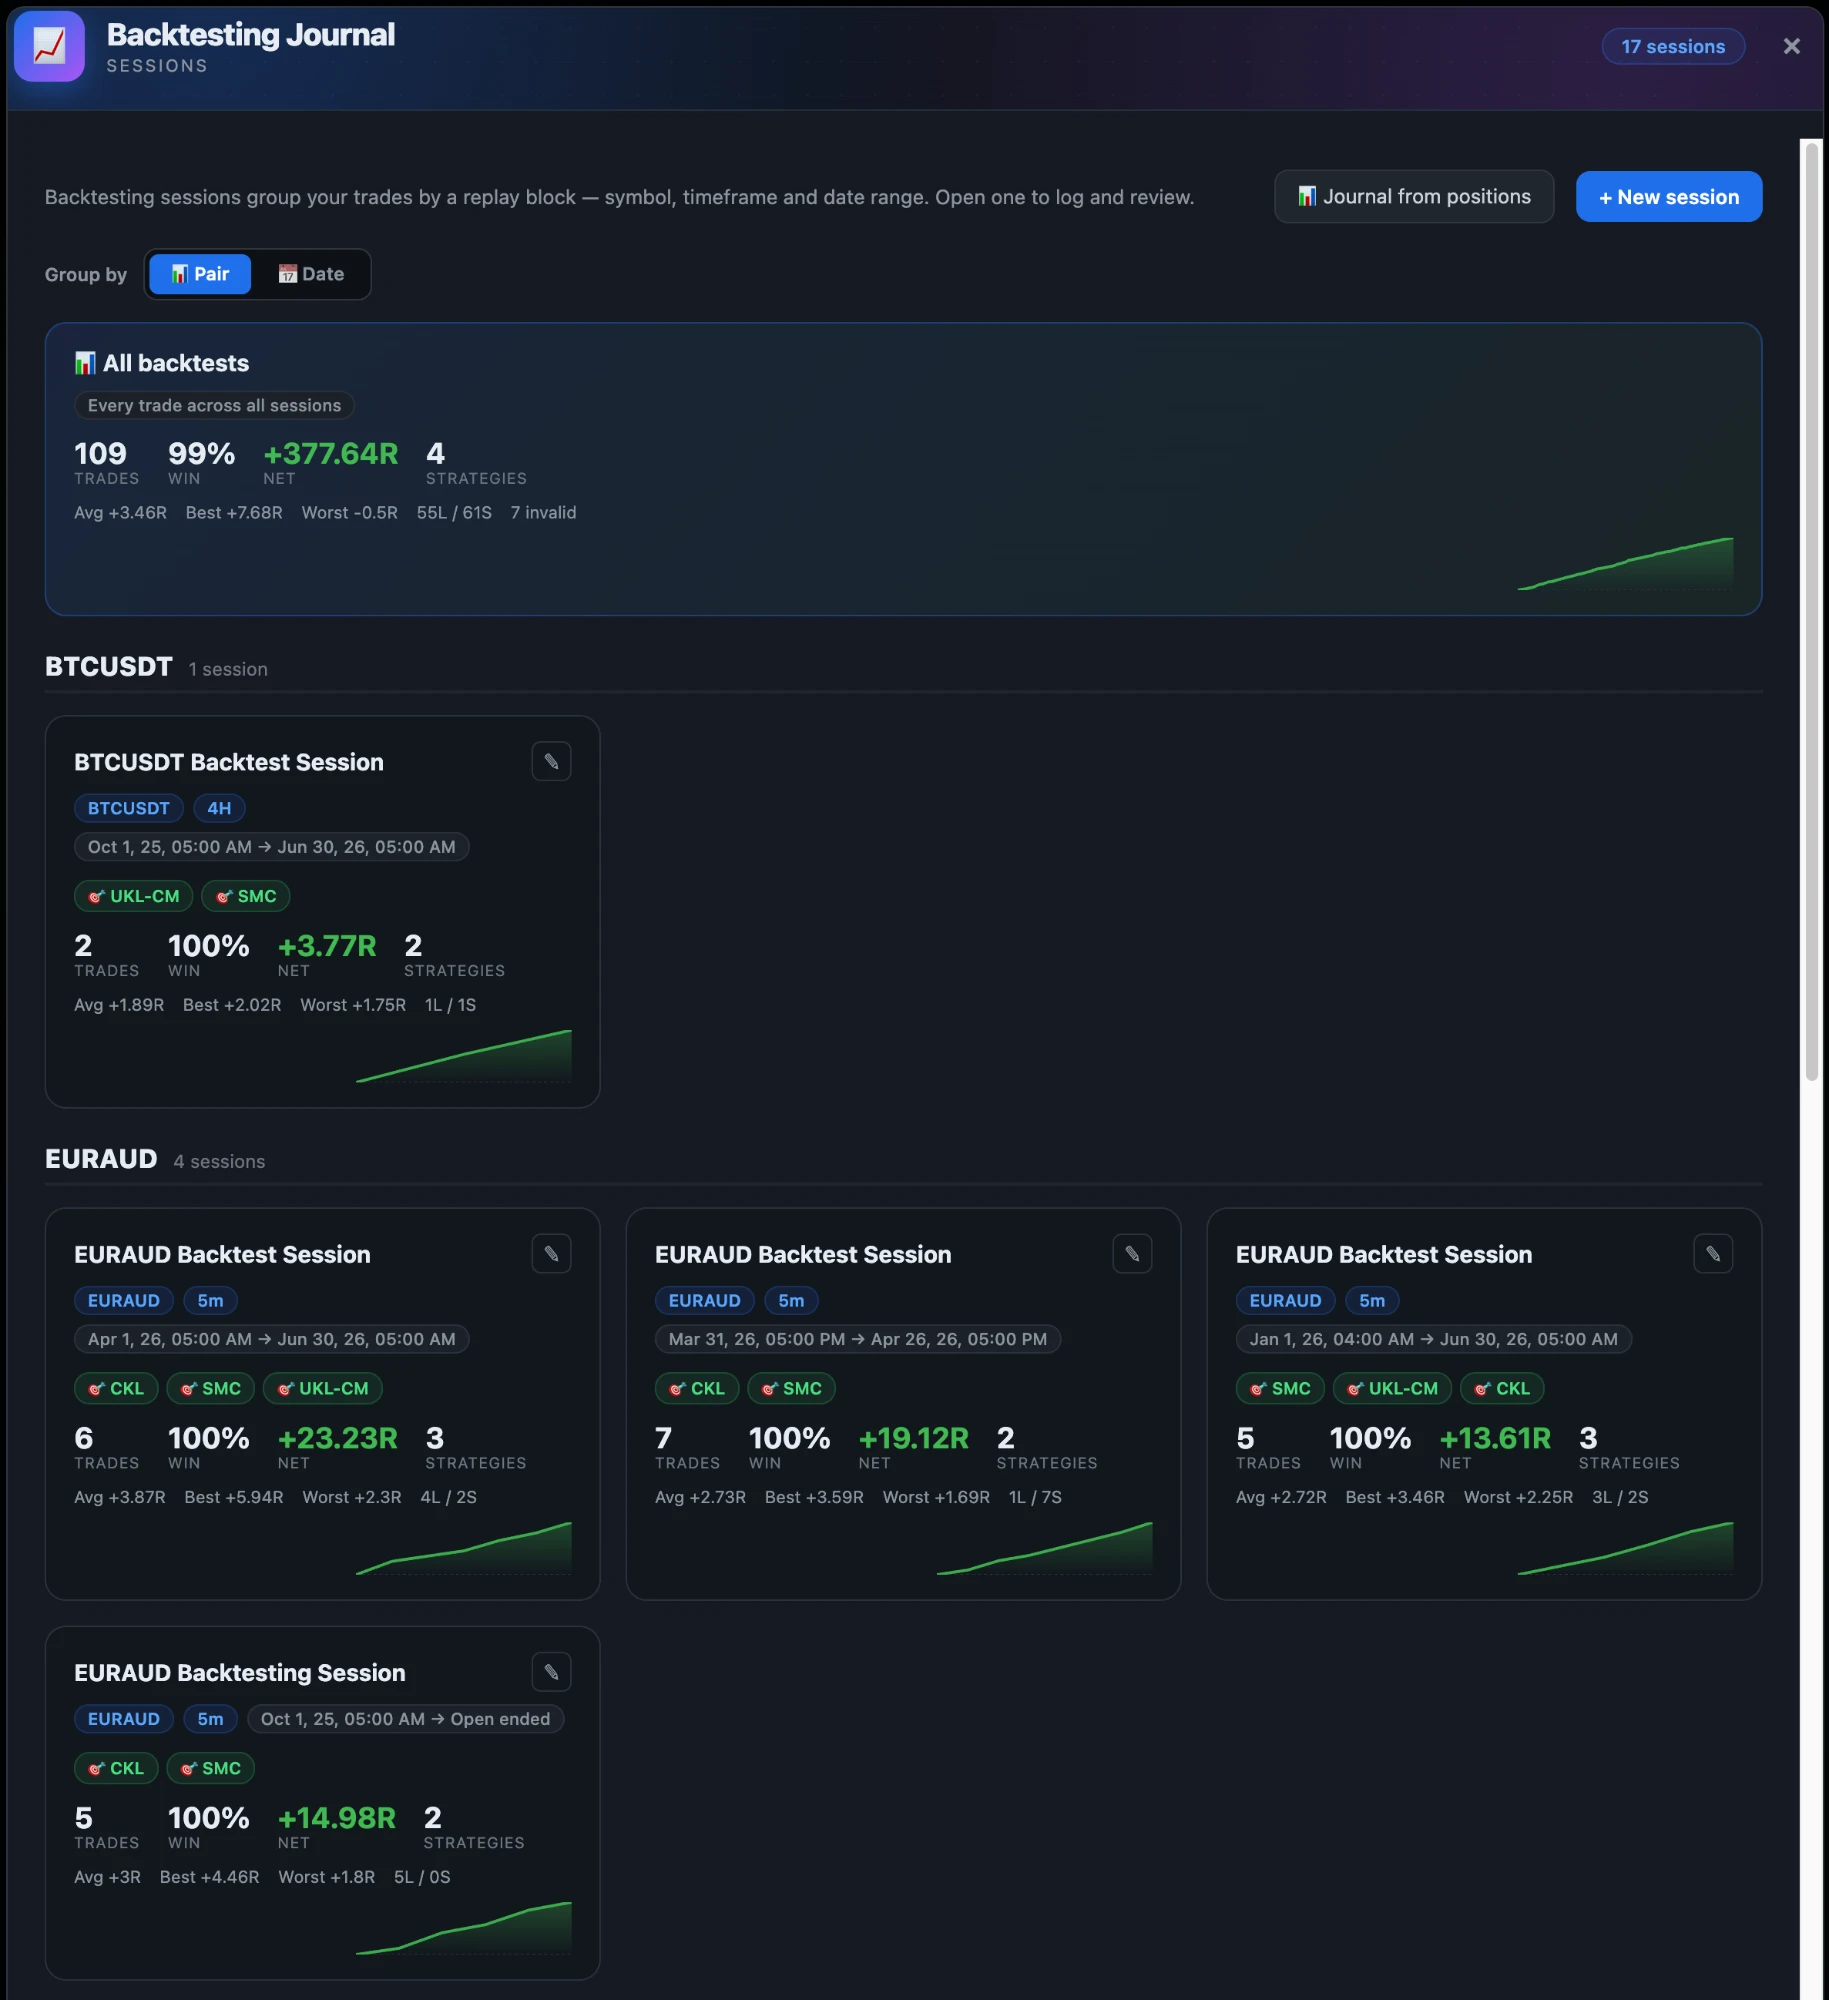
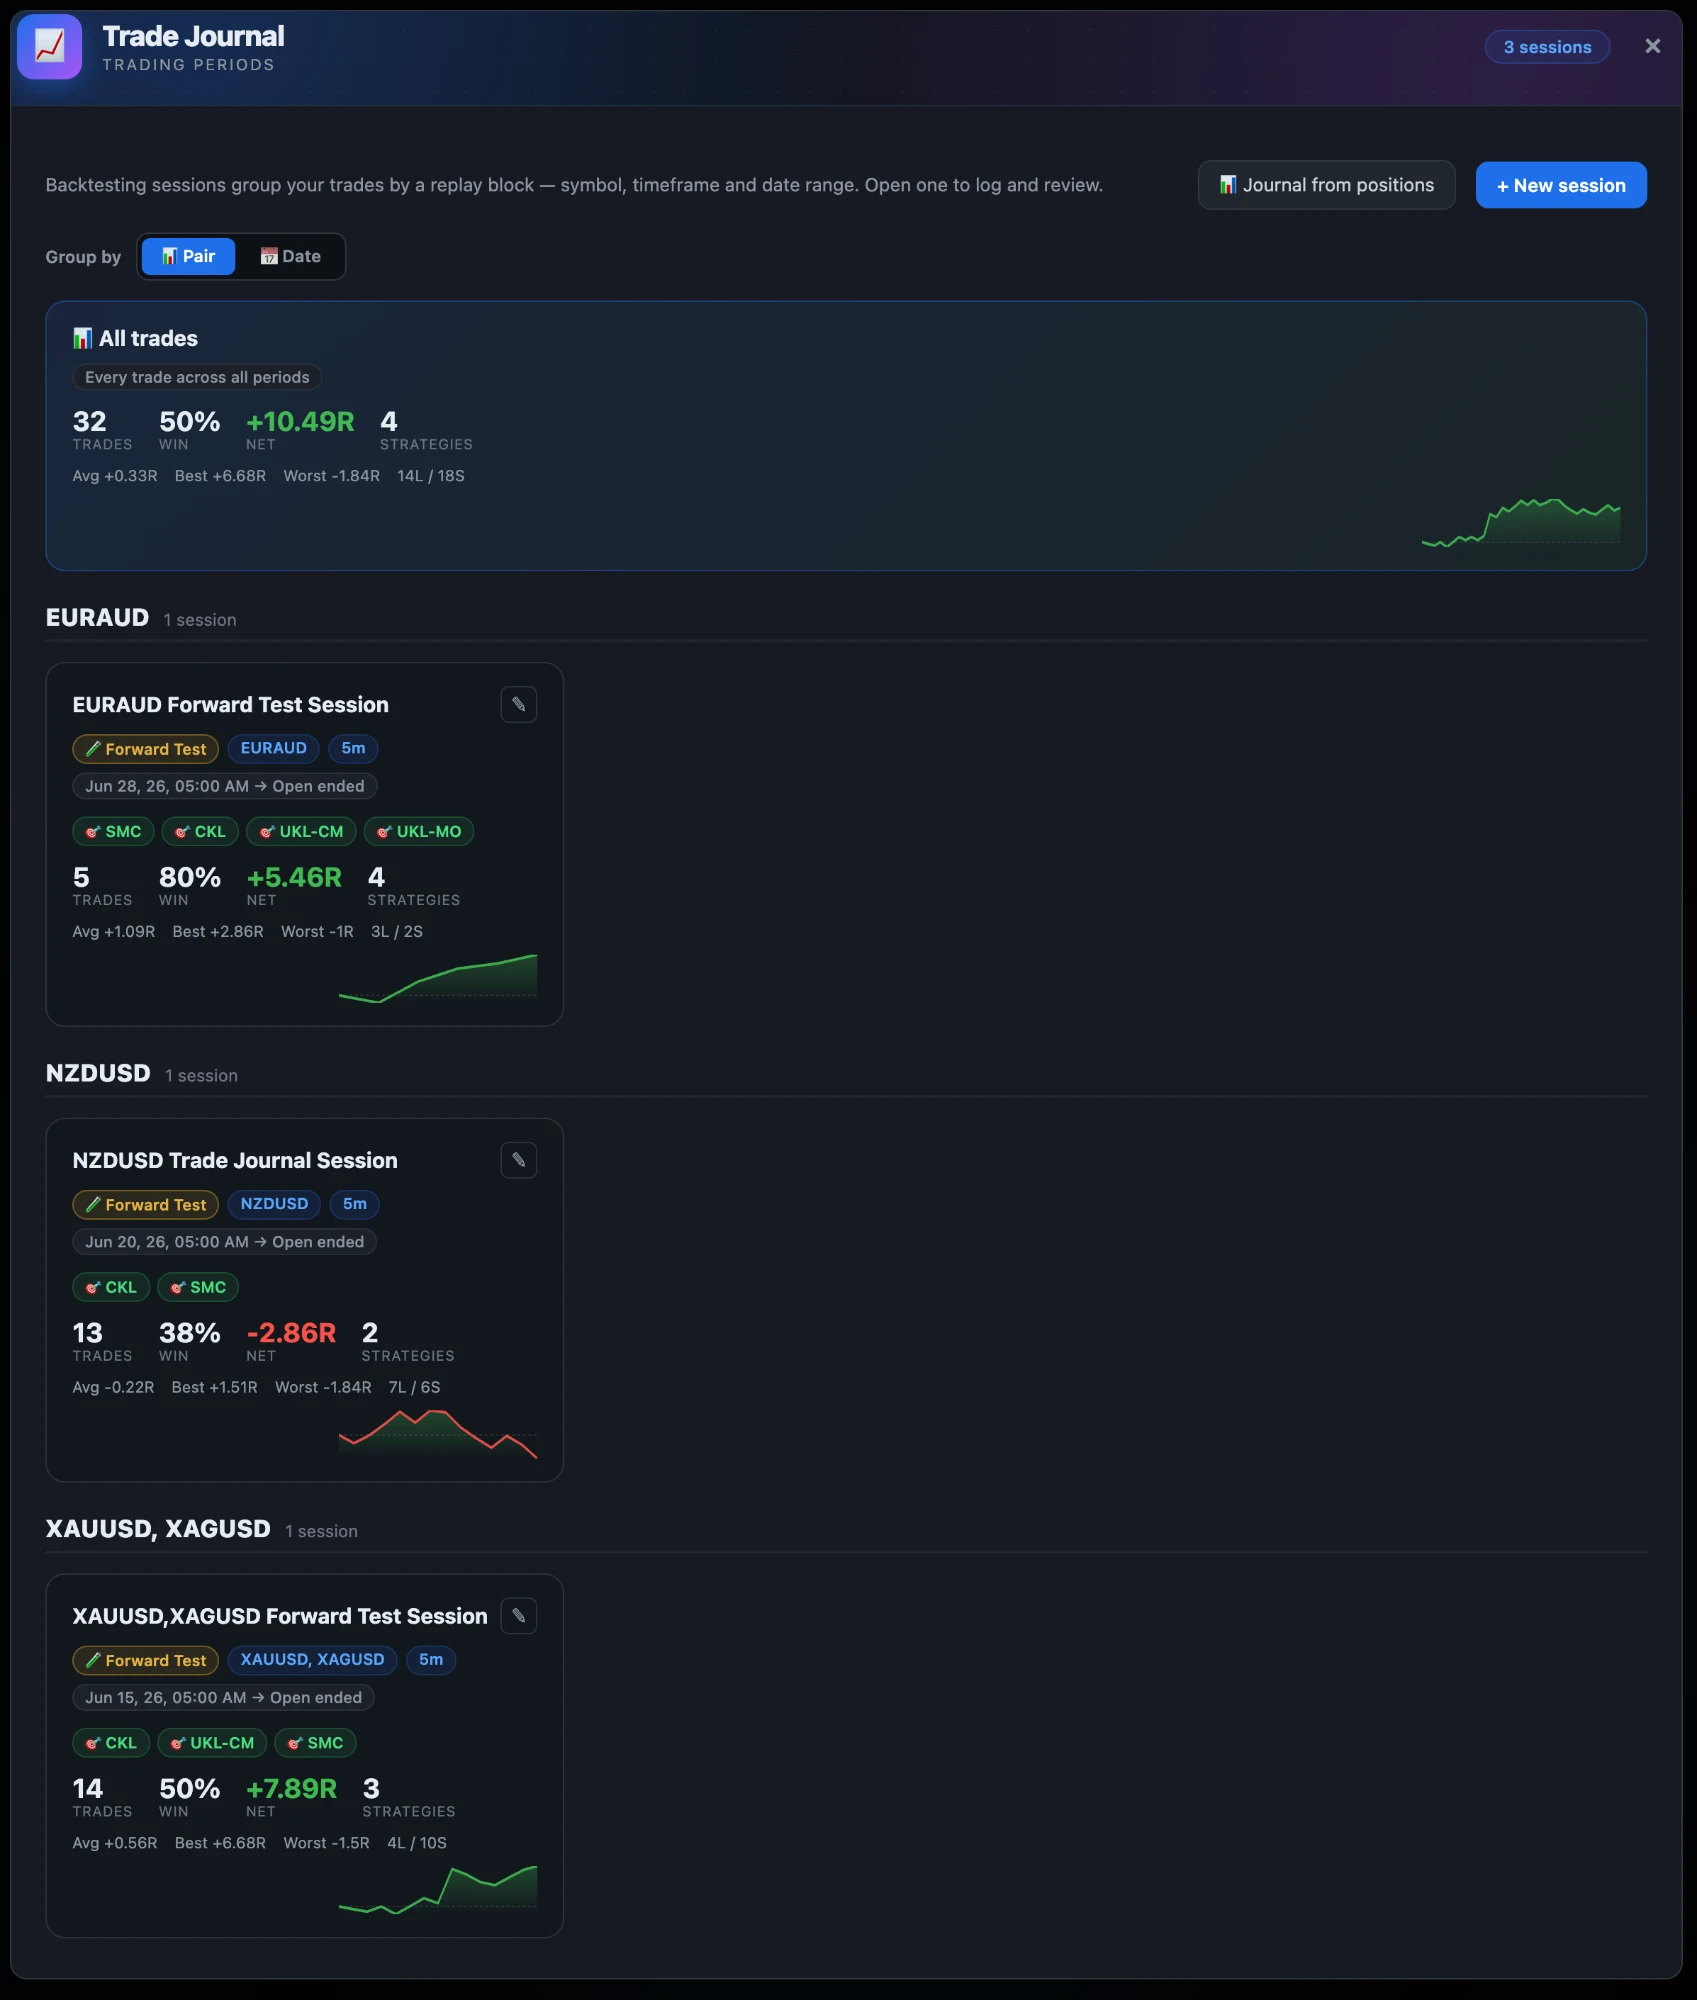
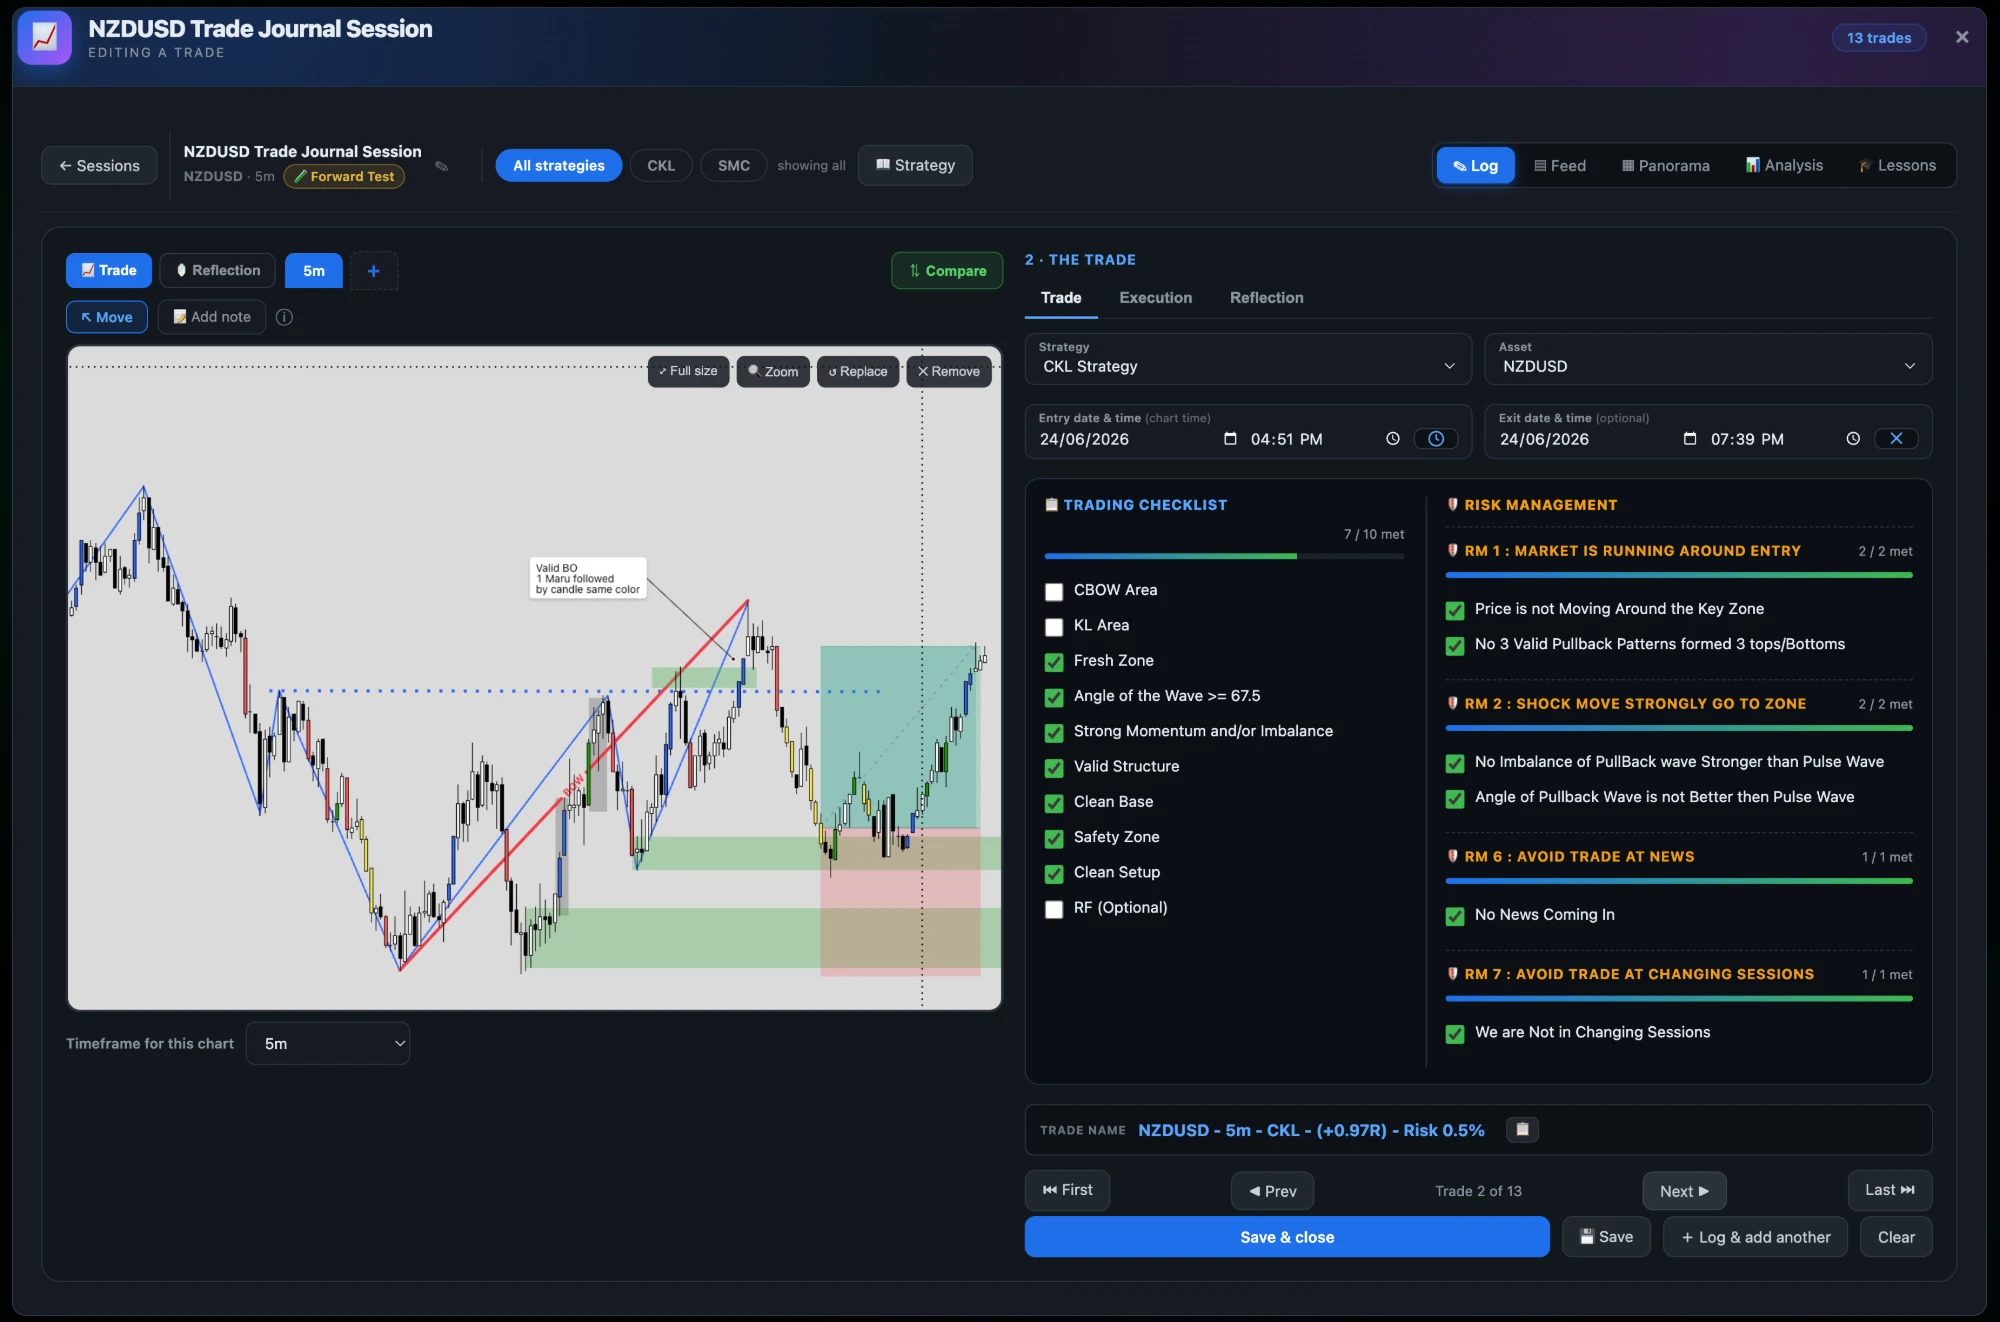
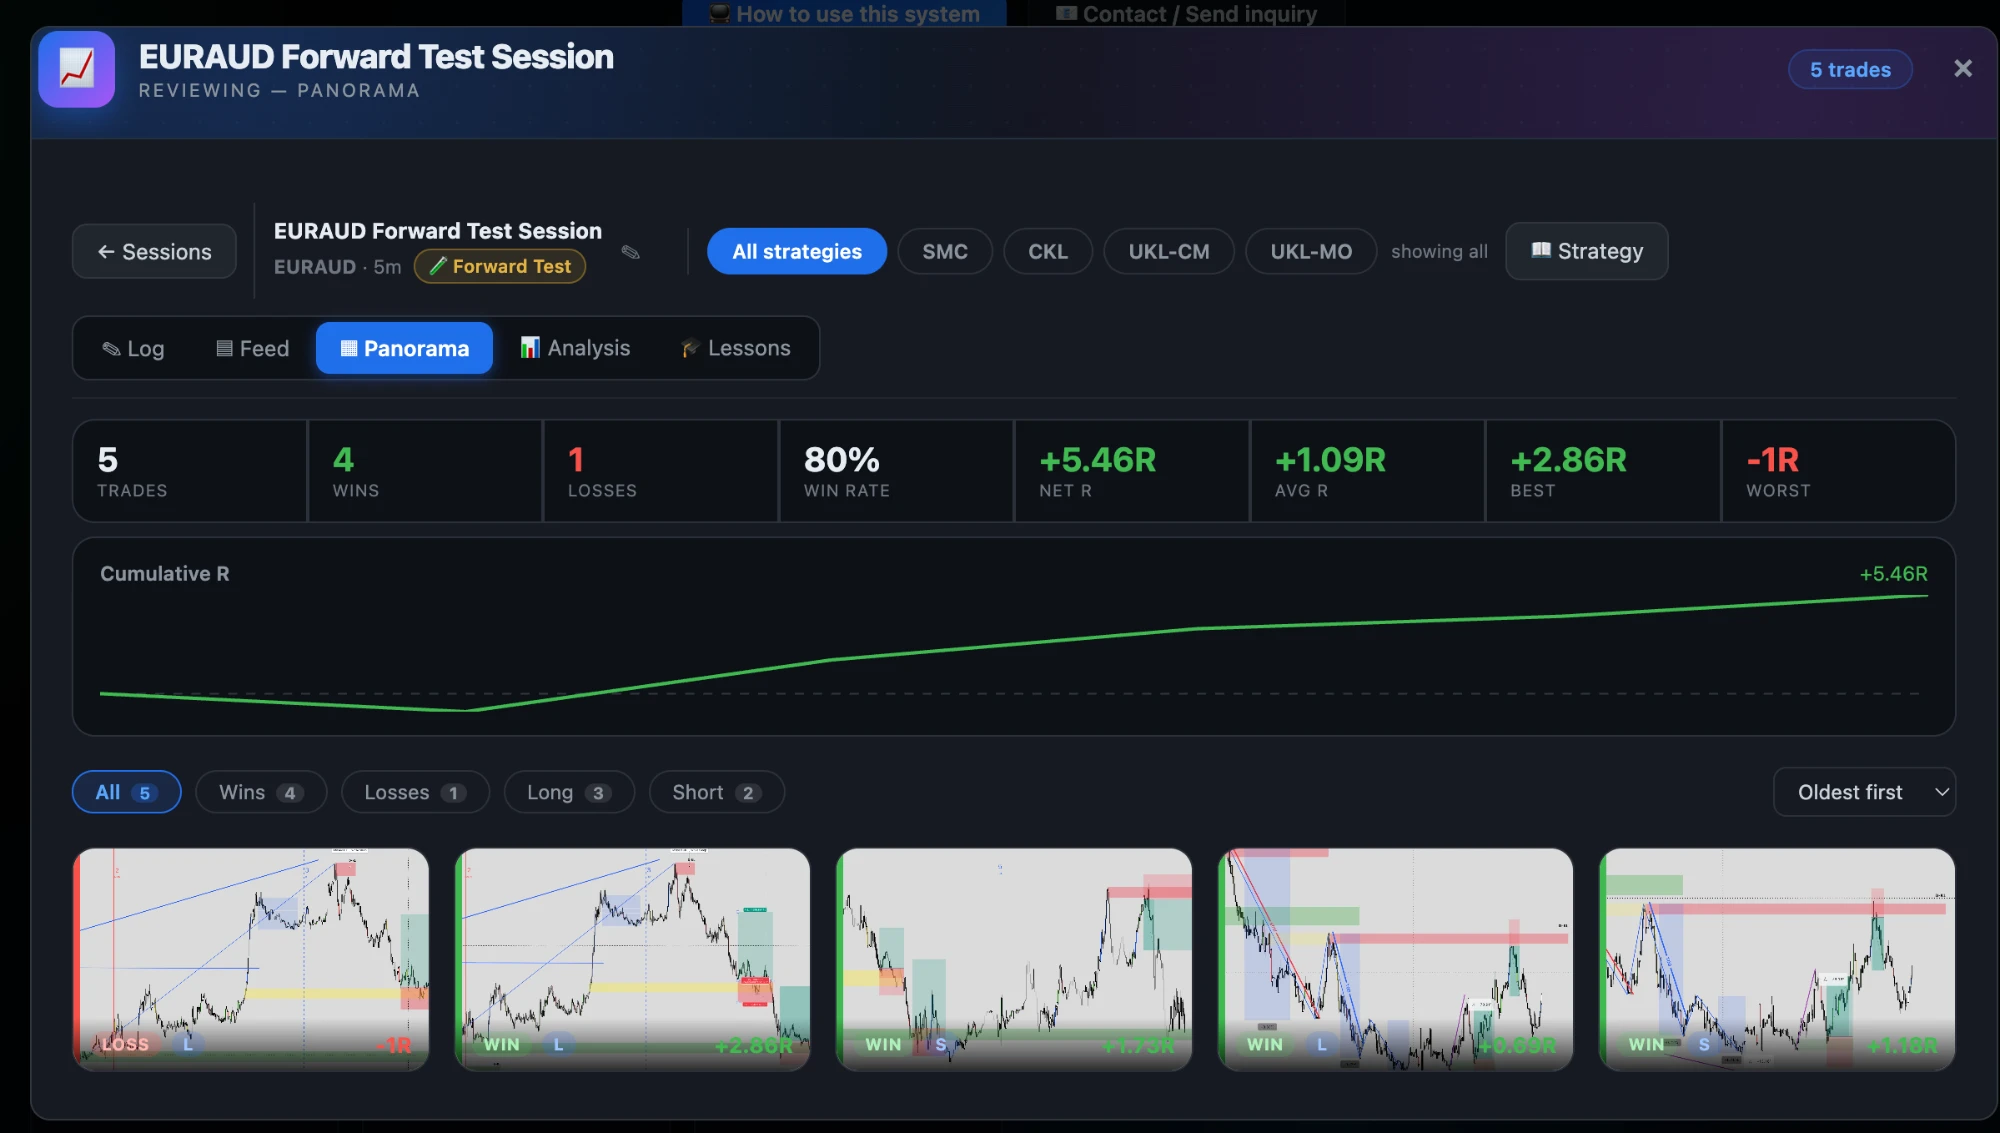
Journal bindingAttach the trade to a journal session and a strategy as you place it, so the record writes itself.
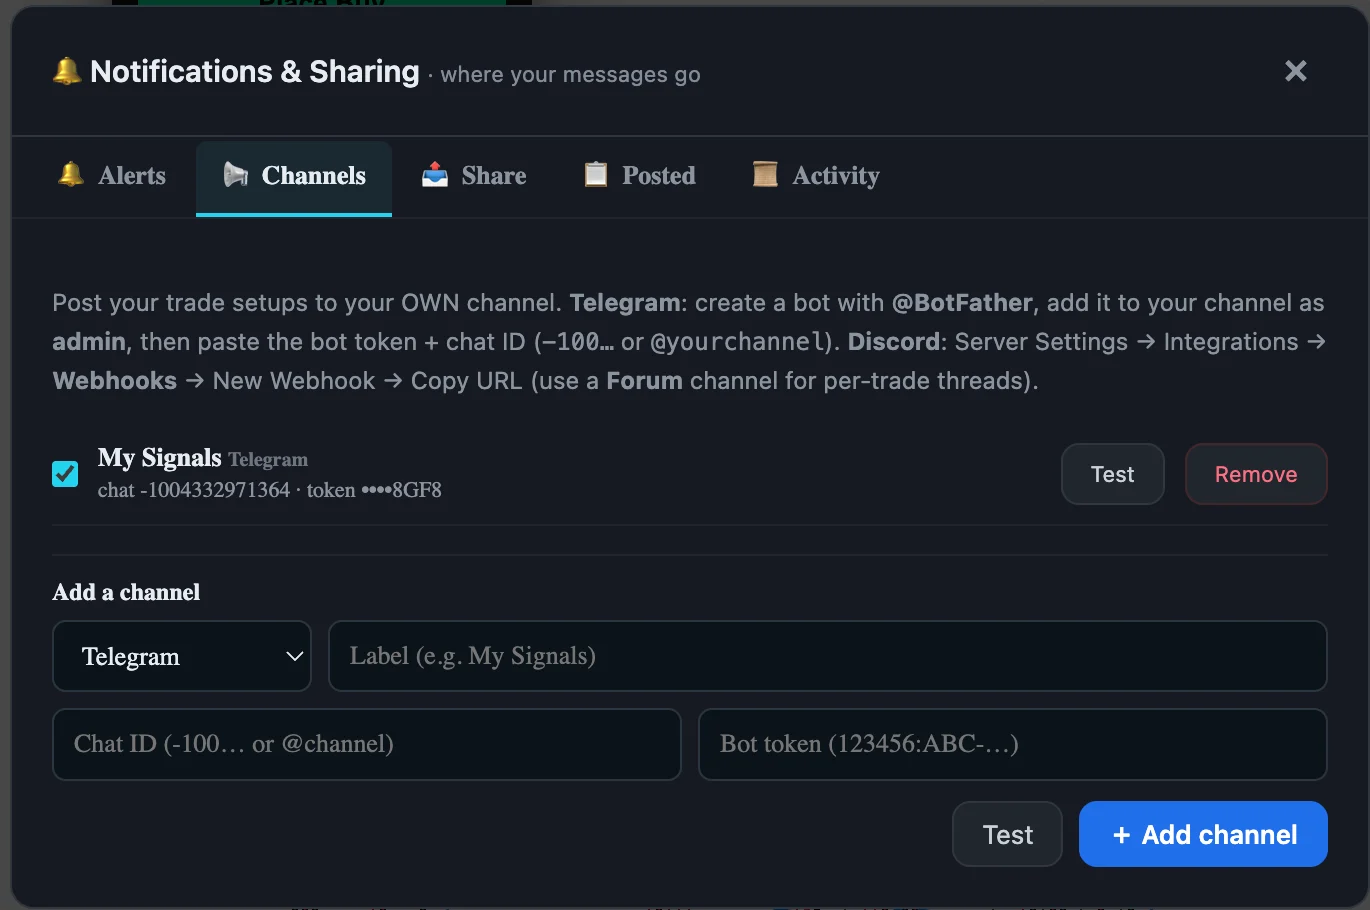
Share itPost the chart with its entry, stop, target and strategy straight to Telegram.
Spread awareToggle whether a market buy is sized against the ask instead of the mid.